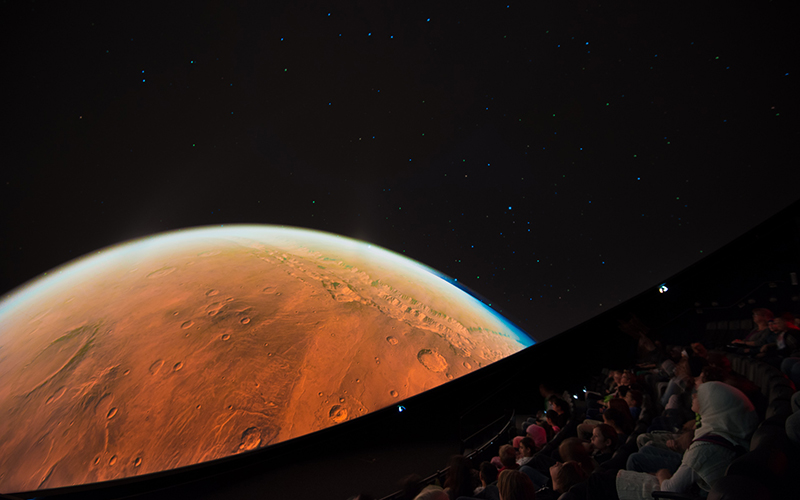
The modern digital planetarium is a powerful data visualization facility. The visualization software Uniview lets you smoothly explore a tremendous array of datasets spanning an incredible range of physical scales, from high resolution maps of Mars to our deepest galaxy surveys. All of which, when used correctly, has great potential to amaze, inform, and most importantly inspire the planetarium going public. Still the opportunity is there to do much, much more.
At the core of realizing that potential is a philosophic shift in the role of the planetarian, from that of a curator of astronomical data to that of an "astronomical weatherperson"1 - an interpreter of the continuous flow of information coming from telescopes, space missions, and computer simulations. Hopefully this will also inspire a shift in how the public views the planetarium from a place to be visited once in a lifetime, or once a new show is released, to a place that one should visit frequently to keep abreast of our growing understanding of our place in the universe.
The Space Visualization Laboratory at the Adler Planetarium.
"We need to stop thinking of data as relics that are stored in modules and collected in repositories and instead start treating data as a dynamic entity that flows in streams to be tapped into."
Data to Dome
To realize this vision we need to streamline the entire process, from identifying and acquiring a scientific dataset to visualizing it in the dome. We need to stop thinking of data as relics that are stored in modules and collected in repositories and instead start treating data as a dynamic entity that flows in streams to be tapped into.
Fortunately there is an open data revolution taking place the sciences, one that in large part is being led by the astronomical community. To take full advantage of this revolution the planetarium needs to learn to feed closer to the source. That means understanding scientific data formats and integrating with the APIs that allow for a direct connection to the major scientific databases. Right now the typical process we follow when we want to add a new dataset to Uniview is something like:
- Figure out where we can get the data from
- Write a program to read in the data
- Perform coordinate transformations and reprojections
- Write out the data files that Uniview can understand
- Load it into Uniview.
In the future all these steps should go away. The software should know when new data becomes available, know how to pull it directly from its source and know how to interpret and visualize it. The result of this transformation will mean that whole rich spectrum of scientific data will be available in our planetaria. And they will be available faster, when a press result comes out in the morning we should be able to display it in the planetarium that afternoon.
Big Data
The big data era is upon us. The first data release from the Gaia satellite is happening this year. The Large Synoptic Survey Telescope is being constructed as I write this. In the realm of computational simulations we’ve been dealing with big data for quite a while. From a visualization perspective "big" means too large to fit on a graphics card – billions of objects. In many cases that data will be too big to even contemplate storing locally. Visualizing this kind of data, interactively and in real-time, requires us to be considerably smarter.

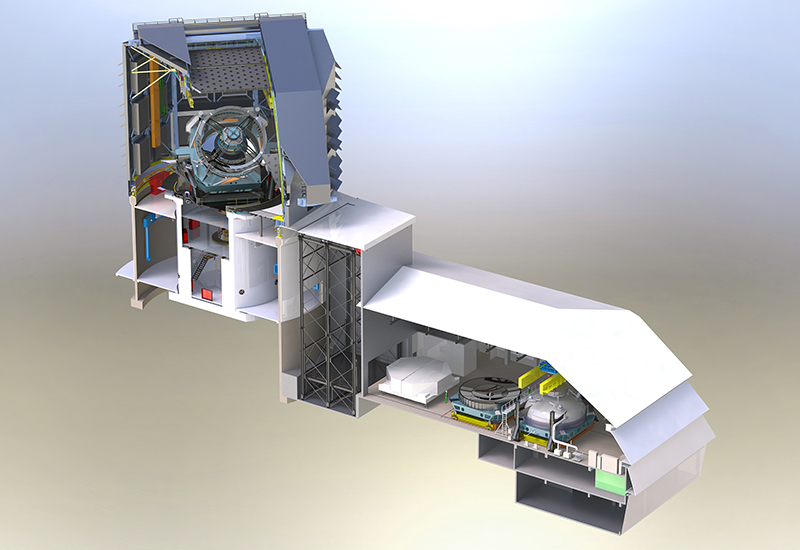
The Large Synoptic Survey Telescope will collect over 30 terabytes each night for ten years. Photo credit: LSST Project Office.
The strategy is to only take what you need to form the image and nothing more. The same type of strategy that allows us to smoothly zoom into maps on our phones can be put to work to visualize data from Gaia, LSST or the latest computational simulations. To be fair going from 2D to 3D (or 4D) adds significant complexity. Solving this problem is the most critical challenge facing the next-generation planetarium software. As an example of what is possible, check out the Halo World web app which visualizes data from the Dark Sky simulation in 3D. It rapidly accesses data from a single 32 Terabyte(!) file and visualizes inside your browser.
Big data requires big screens to visualize. The combination of large solid angle and high resolution make the modern digital planetarium the ultimate big data visualization facility. All of the pixels of the new crop of 8K planetaria will be exploited by the datasets coming from Gaia and LSST.
Data Visualization
We have the opportunity to elevate science communication, telling more sophisticated stories using these large datasets. To do so effectively requires a scientific approach to how a visualization is constructed, incorporating what is known of human perception. For example the classic result of Cleveland and McGill shows that people perceive position more accurately than length, and length more accurately than area, and quantities such as color saturation quite inaccurately. The use of color brings up a whole range of issues. The misleading rainbow colormap is still overused (read Borland and Taylor for details) and abused in science.
Perhaps most importantly when crafting visualizations for the public is understanding the meaning people tend to attach to color (for example red is hot and blue cold in contrast to their physical reality, see the Astronomy and Aesthetics study for details).

Photo credit: barabild.se.
"The data savvy planetarium will be more tightly linked to scientific data streams, intelligent in how it parses huge datasets and better informed in how to best reveal structure through the visualization."
Data Exploration
To recap, the data savvy planetarium will be more tightly linked to scientific data streams, intelligent in how it parses huge datasets and better informed in how to best reveal structure through the visualization. Once this is accomplished we will have created truly world class visualization facilities that will be the envy of every University and research laboratory. Facilities that cannot only be used for data visualization and presentation, but also data exploration, interrogation, and discovery. Add domecasting capabilities into the mix and you have a unique platform for large group, remote, scientific collaboration.
Unfortunately the scientific community (even the professional astronomical community) is vastly unaware of the power and opportunities currently available in the modern, digital planetarium. At worst they view the planetarium as hopelessly outdated, at best they view it as a wonderful tool for inspiring young people and the general public to take an interest in science. Few see it for what it is, a world-class powerful and flexible data visualization tool.
How can we correct this perception? I think it is up to all of us in the planetarium community to invite local scientists into our domes to let them experience seeing their data in the planetarium. Only then will they begin to understand the power of the planetarium. You’ll be rewarded with new visualizations attached to local, personal stories. The planetarium community will be rewarded as well, because slowly word will get out about these amazing facilities that we have created.
1This term was coined by Lars Lindberg Christensen.

